
ITC Mutual Fund Buying October: What the Data Shows
Understand what ITC mutual fund buying in October means, how to verify institutional disclosures, and why funds rebalance their portfolio holdings.

- NV Trends
- 13 min read
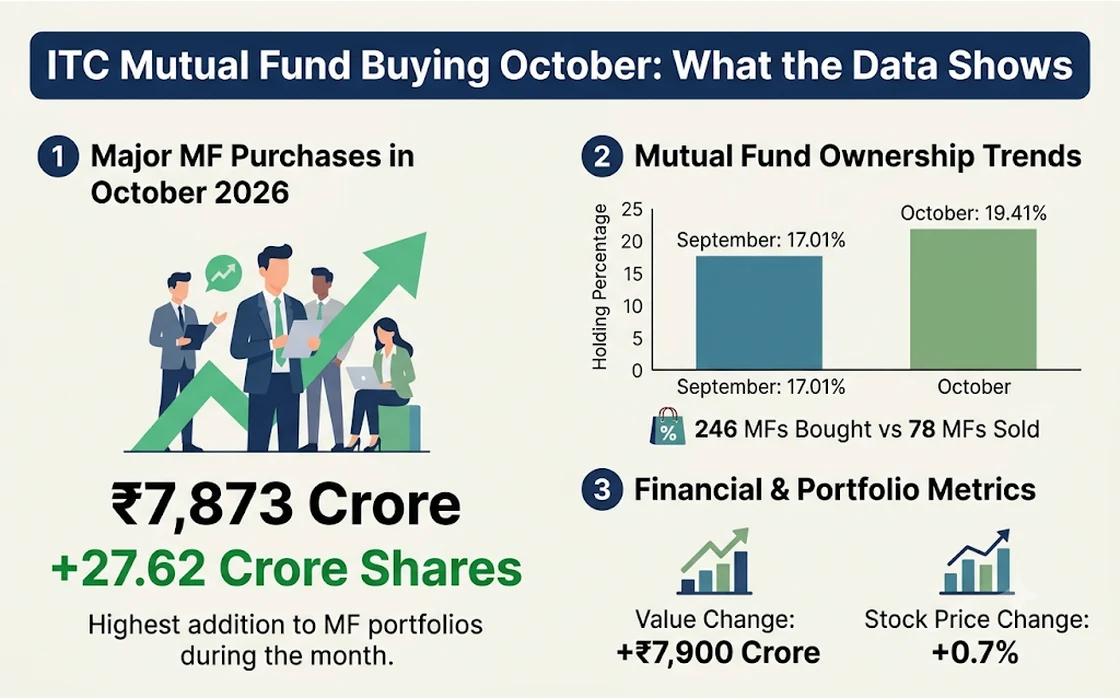
The surge in search interest for “ITC mutual fund buying October” refers to the monthly portfolio disclosures published by Indian asset management companies (AMCs), which reveal the aggregate quantity of ITC Limited shares accumulated by domestic institutional funds during the month of October. Under regulatory guidelines established by the Securities and Exchange Board of India (SEBI), every registered mutual fund house must publish its complete portfolio holdings within ten days of each month’s close. When several large equity schemes increase their exposure to a Nifty 50 heavyweight like ITC at the same time, institutional tracking platforms flag the activity, leading investors to seek the underlying data and rationale.
Tracking mutual fund activity in broad-market anchor stocks offers insight into how institutional managers navigate seasonal shifts and portfolio rebalancing in the middle of the financial year. In October, Indian equity markets frequently experience sector rotation driven by festive retail consumption trends, corporate earnings announcements for the second quarter (July–September), and strategic allocations into defensive, dividend-yielding assets. However, aggregate buying figures reported in media headlines often bundle together entirely different forms of institutional activity, from automated inflows into passive index funds to discretionary stock picks made by active fund managers.
Evaluating these monthly data releases requires looking beyond gross share counts to examine fund category mandates, portfolio weighting adjustments, and the mechanics of regulatory disclosure timelines. This guide explains how institutional buying data is compiled, what drives mutual fund allocations to ITC during October, how to verify these movements using official sources, and how retail investors should interpret institutional accumulation without making premature trading decisions.
Key takeaways
- Monthly institutional buying figures originate from mandatory SEBI portfolio disclosures published by AMCs by the 10th of every month.
- Institutional accumulation in ITC during October typically reflects a mix of defensive rebalancing, dividend-yield tracking, festive FMCG demand expectations, and passive systematic inflows.
- Differentiating between passive buying (such as Nifty 50 index funds matching benchmark weights) and active conviction buys (by flexi-cap or value funds) is essential for accurate analysis.
- Retail investors should avoid “cloning” institutional purchases directly, as reporting lags and portfolio sizing differences introduce significant asymmetry between fund houses and individual portfolios.
What Does “Mutual Fund Buying in October” Actually Mean?
When market reports state that mutual funds “bought” a specific stock in October, they are referencing the net change in share count reported between an AMC’s portfolio filing on September 30 and its filing on October 31. Mutual funds do not report their buy and sell transactions in real time on a daily basis. Instead, they provide a point-in-time snapshot of every security held at the close of the final trading day of the calendar month.
Net Monthly Position Change = Shares Held on October 31 − Shares Held on September 30
If a mutual fund scheme held 1,00,00,000 shares of ITC on September 30 and reports 1,12,00,000 shares on October 31, financial aggregators record this as a net purchase of 12,00,000 shares for October. This net figure does not reveal whether the fund manager purchased all 12 lakh shares on a single trading day, accumulated them gradually over several weeks, or engaged in intermediate trades throughout the month.
Furthermore, investors must distinguish between an increase in holding value and an increase in share quantity. If the market price of ITC increases during October, a fund’s total monetary exposure to the company will rise even if the manager did not purchase a single additional share. Genuine institutional accumulation occurs only when the absolute number of shares held by the fund increases.
Why Fund Managers Rebalance Large-Cap Holdings in October
Institutional portfolio managers manage portfolios worth thousands of crores, operating under strict investment mandates and risk-management frameworks. When domestic mutual funds adjust their exposure to diversified conglomerates like ITC during October, several structural and cyclical factors generally influence their decision.
1. Second-Quarter Earnings and Corporate Fundamentals
October marks the start of the corporate earnings reporting season for the quarter ending September 30. During this period, equity research desks analyze operational volume growth across key business segments, including fast-moving consumer goods (FMCG), agribusiness, paperboards, and hospitality.
Fund managers who anticipate resilient operating margins, stable raw material costs, or steady cash-flow generation may tactically increase allocations to established blue-chip companies ahead of or immediately following quarterly results to manage portfolio volatility.
2. Festive Consumption and Agribusiness Cycles
The month of October regularly coincides with major Indian festive periods, including Navratri, Dussehra, and the lead-up to Diwali. These seasonal events typically trigger elevated consumer spending across packaged foods, personal care, and discretionary retail items.
Additionally, October marks the transition between the Kharif harvest and Rabi sowing seasons in the Indian agricultural calendar. For diversified conglomerates with major agribusiness supply chains, institutional analysts closely assess procurement costs, rural disposable income, and agricultural output to gauge forward earnings stability.
3. Defensive Asset Allocation and Valuation Buffers
During periods of heightened global macroeconomic uncertainty, fluctuating crude oil prices, or stretched valuations in mid-cap and small-cap segments, fund managers often adopt a defensive stance. Large-cap companies characterized by high return on capital employed (ROCE), negligible net debt, and robust free cash flow generation serve as portfolio stabilizers.
ITC has historically exhibited a lower beta compared to broader market indices, making it a frequent candidate for managers looking to reduce overall portfolio volatility while maintaining exposure to Indian domestic consumption.
4. Corporate Actions and Value Realization
Corporate structural changes—such as the planned demerger of business divisions (for instance, the carve-out of hotel assets into a separate listed entity)—frequently alter institutional investment theses. When a large conglomerate undertakes structural realignments to optimize capital allocation, institutional research desks evaluate the potential for value unlocking. Such events often lead value-oriented and special-situation funds to recalibrate their position sizing.
Active Accumulation vs. Passive Inflows: Understanding the Difference
A common mistake among market observers is assuming that every share of ITC purchased by a mutual fund reflects a deliberate, active endorsement by a fund manager. In modern asset management, a large portion of institutional buying is entirely automated through passive funds.
Total Institutional Buying = Active Manager Conviction Buys + Automated Passive Inflows
Passive Inflows (Index Funds and ETFs)
Passive funds—such as Nifty 50 Index Funds, Sensex Index Funds, and corresponding Exchange Traded Funds (ETFs)—do not make active stock selections. Their sole mandate is to replicate the performance of their target benchmark by holding the underlying constituents in exact proportion to their index weights.
When domestic retail investors invest through systematic investment plans (SIPs) into broad-market index funds, the scheme must automatically deploy that capital across all index constituents. If ITC represents approximately 3.8% of the Nifty 50 index, an index fund receiving Rs. 100 crore in net inflows must purchase roughly Rs. 3.8 crore worth of ITC shares, regardless of market sentiment, valuation metrics, or quarterly earnings. A surge in overall market SIP inflows during October directly leads to mechanical buying across index heavyweights.
Active Conviction Buying
In contrast, active schemes—such as flexi-cap, large-cap, and value funds—grant fund managers discretion over stock selection and sector weightings. When looking at equity schemes, as tracked across the Top Performing Equity Funds FY26: Top 10 Schemes, active managers make independent decisions to be “overweight” or “underweight” on specific stocks relative to the benchmark.
When multiple active managers independently choose to allocate discretionary cash into ITC, it signals active institutional conviction. Evaluating a manager’s capital deployment patterns is a central part of broader Fund Manager Performance Analysis: Evaluation Guide, helping investors see whether an active manager is pursuing high-conviction ideas or simply index-hugging.
Comparison: How Different Mutual Fund Categories Treat ITC
Not all mutual funds hold large-cap stocks for the same reasons. The table below outlines how various fund categories incorporate diversified blue-chip companies into their portfolios and what their buying activity indicates.
| Mutual Fund Category | Primary Investment Objective | Role of Large Heavyweights (e.g., ITC) | Primary Buying Trigger in October | Sensitivity to Market Volatility |
|---|---|---|---|---|
| Large-Cap Funds | Capital preservation with steady, benchmark-aligned growth | Core portfolio anchor (typically 3%–7% weighting) | Portfolio rebalancing, sector rotation, quarterly earnings alignment | Moderate; designed to match or slightly outperform broad indices |
| Flexi-Cap Funds | Dynamic allocation across large, mid, and small-cap stocks | Defensive cushion to manage downside risk during volatile phases | Risk mitigation, capital reallocation from fully valued mid-caps | Moderate to High; shifts based on manager’s macro outlook |
| Dividend Yield Funds | Generation of steady dividend income alongside capital growth | Strategic yield anchor with consistent payout history | High dividend payout visibility, corporate distribution announcements | Low to Moderate; prioritized for cash generation |
| Value / Contra Funds | Identifying undervalued or temporarily out-of-favor companies | Long-term value realization and margin of safety | Re-rating potential, structural demergers, favorable valuation multiples | Moderate; focus on medium- to long-term turnaround |
| Index Funds & ETFs | Exact replication of benchmark index performance | Mechanical index constituent matching benchmark weighting | Net retail SIP inflows and regular index rebalancing | Mirrors benchmark; zero active manager discretion |
How to Verify Mutual Fund Buying Data Step-by-Step
Rather than relying on unsourced social media commentary or third-party interpretations, retail investors can verify monthly mutual fund buying data directly through official regulatory channels and established financial platforms.
Monthly Disclosure Timeline:
Month End (e.g., Oct 31) ──> Regulatory Window (Nov 1 to Nov 10) ──> Public Disclosure Published
Step 1: Access Official AMC Monthly Portfolio Disclosures
Under SEBI guidelines, every mutual fund house must post its full portfolio for the preceding month on its website by the 10th day of the current month.
- Navigate to the official website of the specific AMC (e.g., SBI Mutual Fund, HDFC Mutual Fund, ICICI Prudential Mutual Fund).
- Go to the Statutory Disclosures or Downloads section.
- Locate the Monthly Portfolio Disclosure for the relevant month (e.g., October).
- Download the portfolio file (usually provided in
.xlsxformat). - Search for the company name (“ITC Ltd.”) and examine the number of shares held, the market value, and the percentage of net assets allocated.
Step 2: Review Industry-Wide Data on AMFI
The Association of Mutual Funds in India (AMFI) provides consolidated monthly data on overall industry inflows, category-level net investments, and scheme-level assets under management (AUM). Checking AMFI’s monthly releases helps determine whether sector buying was driven by overall industry liquidity or category-specific reallocation.
Step 3: Check Quarterly Shareholding Patterns on Stock Exchanges
While mutual funds report portfolio snapshots monthly, listed companies submit consolidated shareholding patterns to the stock exchanges (NSE and BSE) on a quarterly basis. These filings categorize holdings by:
- Mutual Funds
- Foreign Portfolio Investors (FPIs)
- Insurance Companies
- Retail Individual Investors
Comparing quarterly trends provides a broader perspective on whether domestic institutions are absorbing shares sold by foreign investors or vice versa.
Step 4: Use Reliable Portfolio Analytics Tools
For aggregated comparisons, established market analytics portals compile monthly changes across all active schemes. When utilizing these tools, investors should check our guide on How to Track Your Mutual Fund Performance to see how individual scheme holdings reflect across their personal investment portfolios.
Pitfalls of Copying Institutional Trades (“Coattail Investing”)
When headlines highlight institutional buying in a specific stock, individual investors are often tempted to replicate the trade in their personal brokerage accounts. This practice, known as “coattail investing,” involves significant structural risks that retail investors frequently overlook.
┌──────────────────────────────────────────────────────────────────┐
│              The Institutional Information Asymmetry             │
├────────────────────────────────┬─────────────────────────────────┤
│ Institutional Fund Realities   │ Retail Investor Realities       │
├────────────────────────────────┼─────────────────────────────────┤
│ • Trades execute mid-month     │ • Learns of trade 10-40 days    │
│ • Purchases represent 0.5%–2%  │   after execution               │
│   of a diversified portfolio   │ • Often allocates 10%–30% of    │
│ • Uses derivative hedging      │   personal capital to one stock │
│ • Can exit positions over time │ • Zero hedge against downside   │
│   without reporting instantly  │ • Exits emotionally on dips     │
└────────────────────────────────┴─────────────────────────────────┘
1. The Reporting Lag Problem
Mutual fund disclosures are published up to 10 days after the month ends. If a fund manager bought shares on October 3, the public only learns about this position around November 10—a lag of more than five weeks.
During that intervening period, the stock price may have already factored in the buying pressure, corporate earnings may have been reported, or the fund manager may have already begun trimming the position in early November.
2. Disconnect in Position Sizing and Portfolio Risk
When a fund managing Rs. 25,000 crore buys Rs. 150 crore worth of a stock, that allocation represents less than 0.6% of its total portfolio. Even if the stock declines by 20%, the overall impact on the fund’s Net Asset Value (NAV) is negligible (approximately 0.12%).
Conversely, when a retail investor acts on a headline by purchasing shares with 15% or 20% of their personal capital, they take on substantial single-stock concentration risk without the diversification buffer possessed by an institutional fund.
3. Hedging and Cash-Futures Arbitrage
Headline numbers frequently do not show whether the mutual fund’s purchase was part of a directional long-term investment or an arbitrage strategy.
Arbitrage funds routinely buy shares in the cash market while simultaneously shorting equivalent futures contracts to capture the price spread risk-free. If an arbitrage fund buys 50 lakh shares of ITC in October alongside an offsetting derivative position, counting this as an institutional “bullish bet” is a misinterpretation of the transaction’s purpose.
Practical Checklist: What to Do and What to Avoid
When analyzing monthly institutional buying reports, use this practical framework to separate meaningful market data from noise:
What to Do:
- Verify the fund category: Check whether the buying occurred in active equity funds (large-cap, flexi-cap) or passive ETFs and arbitrage funds.
- Track the percentage change in portfolio weight: A fund increasing its allocation from 2.0% to 4.5% of AUM indicates higher manager conviction than an increase resulting solely from overall fund asset growth.
- Evaluate the investment horizon: Remember that mutual funds hold large-cap stocks over multi-year market cycles rather than short-term trading intervals.
- Examine scheme-level alignment: Determine whether the purchase fits the fund’s stated objective (e.g., a dividend-yield fund purchasing a high-dividend-paying stock).
What to Avoid:
- Avoid buying based purely on monthly headlines: Never purchase individual shares solely because a media report noted institutional buying in the prior month.
- Avoid confusing net purchases with gross volume: Always check net share counts rather than gross transaction value, which can be distorted by stock price swings.
- Avoid ignoring sector allocation limits: Remember that fund houses have regulatory limits preventing them from holding more than 10% of their net assets in a single company; buying may stop simply because a fund has hit its concentration ceiling.
FAQ
Why did search interest for “ITC mutual fund buying October” rise suddenly?
Search spikes occur when monthly mutual fund portfolio disclosures are released in early November, prompting media outlets to publish reports detailing which stocks saw the largest net accumulation by domestic institutions during October. Retail investors search this phrase to verify whether fund managers made significant new bets on the stock.
Where can an investor find verified data on mutual fund portfolio changes?
Official portfolio holdings can be verified directly on the statutory disclosure pages of respective asset management company websites, which publish monthly portfolio spreadsheets by the 10th of every month under SEBI guidelines. Aggregated summaries are also compiled by registered analytics portals and AMFI releases.
Does significant mutual fund buying guarantee a stock’s price will rise?
No. Institutional buying does not guarantee future price increases. Large purchases may be driven by passive index replication, hedging strategies, or long-term value positioning that can take months or years to reflect in market prices, during which broader market conditions may lead to short-term declines.
What is the difference between active buying and passive buying of ITC shares?
Active buying occurs when an active fund manager exercises discretion to increase a fund’s exposure to a company based on corporate valuation and fundamental outlook. Passive buying happens automatically when index funds and ETFs purchase shares to mirror benchmark indices like the Nifty 50 following retail systematic investment inflows.
Conclusion
Reports highlighting “ITC mutual fund buying in October” reflect the regular, regulated cycle of institutional portfolio disclosures in India. While tracking institutional flows provides valuable insight into broader capital allocation trends, corporate earnings positioning, and sector rotations, it should not be treated as a direct trading indicator.
Institutional purchases reflect unique portfolio sizes, specific regulatory constraints, and multi-year investment horizons that differ fundamentally from the needs of an individual investor. Instead of attempting to copy institutional trades after reporting delays, investors are better served by focusing on overall portfolio asset allocation, understanding fund manager strategies, and making investment decisions aligned with their personal financial goals and risk tolerance.
- Tags:
- Mutual Funds
- Itc
- Portfolio Disclosures
- Equity Investing
- Institutional Buying
- Personal Finance