
Fund Manager Performance Analysis: Evaluation Guide
Master fund manager performance analysis with risk-adjusted metrics, rolling returns, and qualitative checks to identify elite mutual fund managers.

- NV Trends
- 15 min read
- Updated
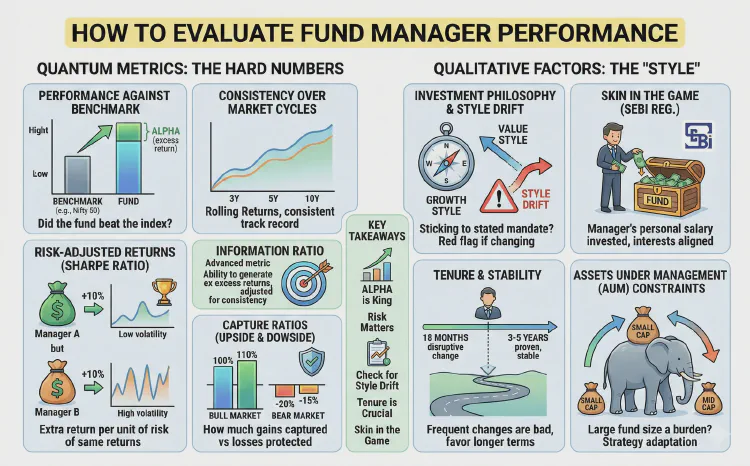
Fund manager performance analysis is the structured quantitative and qualitative evaluation of an active mutual fund manager’s ability to generate sustainable, risk-adjusted excess returns (alpha) through disciplined security selection and asset allocation, rather than market momentum or unhedged portfolio risk. In the Indian asset management ecosystem, where domestic investors channel tens of thousands of crores of rupees into equity schemes each month through Systematic Investment Plans (SIPs), evaluating the human decision-maker behind a scheme ensures that active management fees deliver verifiable economic value.
When an investor allocates capital to an actively managed equity fund, they pay a Total Expense Ratio (TER) that typically ranges from 0.50% to 1.25% for Direct plans and 1.50% to 2.25% for Regular plans. In exchange, the fund manager is expected to construct a portfolio capable of beating its designated benchmark index over a complete market cycle. If a manager merely mirrors the benchmark—an industry phenomenon known as “closet indexing”—the investor incurs active management fees for passive outcomes, resulting in severe compounded underperformance over long investment horizons.
As of 2026, dynamic market valuations, shifting sector rotations, and unprecedented asset expansion across Indian mutual funds make manager evaluation more complex than ever. Relying solely on trailing three-year or five-year compound annual growth rates (CAGR) exposes investors to point-to-point recency bias, often prompting entries into overheated cyclical strategies just before mean reversion takes hold. An institutional-grade evaluation protocol balances multi-cycle rolling returns, risk-adjusted ratios, portfolio attribution, style consistency, and regulatory alignment.
Key takeaways:
- Prioritize multi-year rolling returns over point-to-point CAGR to eliminate start- and end-point bias across varying bull and bear market cycles.
- Scrutinize risk-adjusted metrics such as the Sortino Ratio and Information Ratio to confirm that excess returns reflect genuine stock-picking skill rather than reckless downside exposure.
- Examine upside and downside capture ratios, seeking managers who capture more than 100% of benchmark rallies while limiting downside participation to under 80%.
- Monitor style drift and AUM capacity constraints, especially in small-cap and mid-cap funds where ballooning asset bases can dilute strategy execution and impair liquidity.
- Audit regulatory disclosures, including mandatory “skin-in-the-game” allocations governed by the Securities and Exchange Board of India (SEBI), to ensure manager compensation directly aligns with unitholder outcomes.
Why Fund Manager Performance Analysis Matters for Indian Investors
In passive vehicles like exchange-traded funds (ETFs) and index funds, the fund manager’s role is mechanical: replicate the target basket and minimize tracking error. In contrast, active equity funds in India grant managers wide latitude over cash allocations, sector exposures, stock concentration, and market-cap tilts within the boundaries set by SEBI category mandates.
A skilled fund manager delivers alpha by identifying mispriced earnings growth, avoiding corporate governance traps, and maintaining strict valuation discipline when speculative euphoria grips Dalal Street. Conversely, an undisciplined manager can permanently impair shareholder capital by chasing momentum at market peaks, averaging down on structural value traps, or sitting on excessive cash during early-stage bull runs.
Because active management fees compound continuously against the portfolio NAV, an unvetted manager can cost an investor several lakhs of rupees over a decade. Integrating rigorous manager evaluation into your routine alongside learning how to track your mutual fund performance empowers investors to distinguish between skill-driven outperformance and temporary market tailwinds, enabling proactive portfolio rebalancing before persistent underperformance compounds.
Core Quantitative Metrics for Fund Manager Performance Analysis
Evaluating an active manager requires looking beyond standard marketing factsheets. A robust quantitative framework uses statistical parameters designed to isolate selection skill from market beta, quantify downside protection, and assess risk-adjusted efficiency.
1. Rolling Returns vs. Point-to-Point CAGR
Trailing point-to-point returns (such as 1-year, 3-year, or 5-year CAGR) suffer from severe end-point sensitivity. For example, if an evaluation date coincides with the peak of a speculative mid-cap rally, trailing three-year figures will appear exceptional even if the fund lagged its benchmark for most of that period.
Rolling returns eliminate this distortion by calculating annualized returns across thousands of overlapping holding periods rolled daily across a 7-to-10-year timeframe:
- Return Consistency: Rolling return distributions reveal a fund’s minimum, median, and maximum historical performance, illustrating what investors experienced regardless of their initial entry date.
- Outperformance Frequency: A top-tier active manager should beat their category Total Return Index (TRI) benchmark in at least 70% of rolling 3-year windows and over 80% of rolling 5-year windows.
2. Jensen’s Alpha and Total Return Index (TRI) Benchmarks
Jensen’s Alpha measures the excess return generated by a portfolio over and above its theoretical return predicted by the Capital Asset Pricing Model (CAPM), based on its systemic risk (Beta):
$$\alpha = R_p - [R_f + \beta \times (R_m - R_f)]$$
Where:
- $R_p$ = Realized portfolio return
- $R_f$ = Risk-free rate (typically the 91-day Indian Treasury Bill yield or 10-year G-Sec yield)
- $\beta$ = Fund sensitivity relative to the market index
- $R_m$ = Benchmark return
According to regulatory standards mandated by SEBI and published guidelines from the Association of Mutual Funds in India (AMFI), Indian mutual funds must benchmark their performance against Total Return Indices (TRI), which incorporate dividend reinvestment alongside capital gains. If a fund reports a 16% annualized return against a benchmark TRI return of 14% but operates with an aggressive Beta of 1.25 during a raging bull market, the manager’s Jensen’s Alpha may actually be negative once adjusted for the higher risk incurred. In active Indian equity funds, a net-of-fees Jensen’s Alpha of 2.0% to 3.5% across a five-year cycle signals persistent managerial edge.
3. Risk-Adjusted Ratios: Sharpe, Sortino, and Treynor
High nominal returns mean little if achieved through disproportionate portfolio volatility. Risk-adjusted metrics evaluate how effectively a manager converts risk into reward:
- Sharpe Ratio: Measures excess return relative to total portfolio standard deviation: $$\text{Sharpe Ratio} = \frac{R_p - R_f}{\sigma_p}$$ A major limitation of the Sharpe ratio is that it penalizes upward volatility (rapid upside rallies) equally alongside downward volatility (drawdowns).
- Sortino Ratio: Fixes this limitation by substituting total standard deviation with downside deviation ($\sigma_d$), penalizing only those returns that fall below a minimum acceptable threshold: $$\text{Sortino Ratio} = \frac{R_p - R_f}{\sigma_d}$$ Because investors are primarily concerned with capital preservation during corrections, the Sortino ratio is a superior measure of manager skill. In Indian diversified equity funds, a Sortino ratio consistently exceeding 1.8 to 2.2 indicates exceptional risk mitigation during downturns.
- Treynor Ratio: Divides excess return by systematic market risk (Beta). It measures how effectively the manager rewards unitholders for bearing non-diversifiable equity market volatility.
4. Information Ratio and Tracking Error
The Information Ratio (IR) is widely utilized by institutional allocators to assess active manager consistency. It measures active excess return relative to the benchmark divided by tracking error (the annualized standard deviation of those excess returns):
$$\text{Information Ratio} = \frac{R_p - R_b}{\text{Tracking Error}}$$
Where $R_p - R_b$ represents active return. A high Information Ratio demonstrates that a manager’s outperformance is steady, uniform, and dependable across market phases, rather than the byproduct of a few concentrated, speculative bets. An Information Ratio between 0.50 and 0.75 reflects solid active management in Indian equities, while a reading consistently above 1.0 indicates elite execution.
5. Upside and Downside Capture Ratios
Capture ratios measure how a fund behaves relative to its benchmark during directional market swings:
- Upside Capture Ratio: The fund’s compound monthly return during positive market months expressed as a percentage of the benchmark’s return. An Upside Capture of 105% indicates the fund generated 5% more return than the index during rallies.
- Downside Capture Ratio: The fund’s compound performance during negative benchmark months. A Downside Capture of 75% indicates the fund absorbed only three-quarters of the market’s decline.
- The Ideal Profile: Superior managers maintain an asymmetric profile—capturing 95% to 105% of upside rallies while keeping downside capture below 75% to 80%. This asymmetry is the primary driver of multi-year compounding.
6. Maximum Drawdown and Calmar Ratio
Maximum Drawdown (MDD) tracks the largest peak-to-trough decline in a fund’s NAV before a new peak is achieved. Complementing this is the Calmar Ratio, which divides the fund’s annualized return by its absolute Maximum Drawdown over a 36-month period:
$$\text{Calmar Ratio} = \frac{\text{Annualized Return}}{\text{Maximum Drawdown}}$$
A high Calmar ratio (above 0.80 to 1.0 in Indian equities) indicates that a manager delivers attractive compounding without subjecting investors to panic-inducing capital declines during broad market crashes.
Quantitative Metrics Comparison Table
The following table summarizes the primary quantitative metrics used in fund manager performance analysis, detailing their analytical purpose and typical benchmarks for Indian equity schemes:
| Metric | Formula / Calculation Basis | Benchmark / Ideal Range | Key Insight for Investors |
|---|---|---|---|
| Rolling Returns (5-Year) | Annualized CAGR rolled daily across a 7–10 year window | >80% outperformance vs. Benchmark TRI | Confirms returns are repeatable regardless of market entry timing. |
| Jensen’s Alpha ($\alpha$) | Excess return above CAPM: $R_p - [R_f + \beta(R_m - R_f)]$ | >2.0% to 3.5% annualized net of fees | Proves whether manager beats market through skill or leverage. |
| Sortino Ratio | Excess return divided by downside deviation: $\frac{R_p - R_f}{\sigma_d}$ | >1.8 to 2.2 in diversified equities | Measures downside protection without penalizing upside rallies. |
| Information Ratio (IR) | Active return divided by tracking error: $\frac{R_p - R_b}{\text{Tracking Error}}$ | >0.50 (Good), >1.00 (Elite) | Gauges outperformance consistency and active risk efficiency. |
| Downside Capture | Performance in down months / Benchmark return in down months | <75% to 80% | Demonstrates capital preservation during market downturns. |
| Calmar Ratio | 3-Year Annualized Return / 3-Year Maximum Drawdown | >0.80 to 1.0 | Evaluates recovery speed and pain tolerance relative to returns. |
Qualitative Framework: Evaluating the Human Element
Quantitative metrics measure past outcomes, but qualitative analysis reveals whether those outcomes are repeatable. When conducting fund manager performance analysis, evaluating structural constraints, behavioral discipline, and organizational incentives is equally vital.
1. Investment Philosophy and Mandate Discipline
Every active manager operates under a declared philosophy—such as Growth at a Reasonable Price (GARP), deep value contrarianism, quality compounders, or top-down thematic macro.
Investors must evaluate whether the manager adheres to their declared philosophy during challenging phases:
- Style Drift: When a value-oriented manager starts buying high-flying momentum tech stocks at extreme multiples simply to match short-term peer performance, style drift has occurred. This alters the risk profile of your portfolio.
- Mandate Integrity: In flexi-cap or multi-cap categories, check whether the manager maintains authentic cross-cap diversification or takes refuge in large-cap defensives, turning the fund into an overpriced index proxy.
Reviewing fund disclosures, as outlined in our guide on how to read mutual fund fact sheets, provides transparency into monthly sector allocations and stock concentration trends.
2. Portfolio Turnover and Trading Friction
Portfolio turnover ratio (PTR) measures the frequency with which a fund’s holdings are bought and sold over a 12-month period. A PTR of 25% implies an average holding period of four years, reflecting high-conviction, bottom-up investing. Conversely, a PTR exceeding 150% indicates aggressive short-term trading.
Frequent trading incurs brokerage fees, securities transaction tax (STT), custodian charges, and bid-ask slippage. These frictional costs are directly absorbed by the scheme NAV. For an in-depth breakdown of how churn impacts net compounding, consult our guide on understanding fund portfolio turnover ratio.
Low Turnover (<30%)    ──> High Conviction, Lower Friction Costs, Long-Term Compounding
Moderate (30% - 80%)   ──> Tactical Rebalancing, Periodic Profit-Taking
High Turnover (>100%)  ──> Aggressive Churn, High Brokerage/STT Drag, Execution Risk
3. AUM Growth and Liquidity Capacity Drag
One of the toughest challenges for an Indian active equity manager is managing size. In large-cap funds, an asset base of Rs. 40,000 crore is manageable because the underlying universe consists of highly liquid Nifty 100 stocks.
In mid-cap and small-cap schemes, however, surging AUM can quickly dilute outperformance:
- Liquidity Drag: If a small-cap fund manages Rs. 30,000 crore, building or exiting a meaningful 3% position (Rs. 900 crore) in a company with a free float of Rs. 3,000 crore can take weeks of trading, causing significant price impact costs.
- Portfolio Bloat: To deploy cash inflows, the manager is often forced to expand holdings from an optimal 35–45 stocks to 80–100 names, effectively transforming a high-conviction alpha strategy into a diluted market basket.
- Cash Drag: Managers inundated with SIP inflows may hold 8% to 15% in cash or cash equivalents when market valuations are stretched, lagging during strong market rallies.
4. Fund House Stability and Analyst Support
A fund manager rarely operates in isolation. Their success depends heavily on the institutional ecosystem provided by the Asset Management Company (AMC):
- Research Bench Strength: Does the AMC employ dedicated sector analysts, forensic accounting specialists, and channel checkers to support the Chief Investment Officer (CIO)?
- Key-Person Risk: Schemes heavily reliant on a single “star” manager face severe transition risk if that manager departs. Institutionalized, process-driven fund houses institutionalize decision-making through formal investment committees, reducing disruption when personnel changes occur.
5. Regulatory Alignment: SEBI Skin-in-the-Game Mandates
Under SEBI regulations, mutual fund houses must ensure that key employees, including fund managers, invest a minimum of 20% of their net salary and performance perks into units of the schemes they oversee. These investments are locked in for a minimum of three years or the tenure of the scheme.
Examining these disclosures confirms that the fund manager shares the exact financial upside and downside risks experienced by retail investors, providing strong protection against reckless risk-taking.
Common Mistakes to Avoid in Fund Manager Performance Analysis
Even sophisticated investors frequently commit cognitive and analytical errors when assessing active managers:
- Chasing Short-Term Performance Tables: Buying a fund based solely on its 1-year return rank on financial portals is the single most common pitfall. Top-performing funds in any single year usually achieve their rank through concentrated sector bets that often suffer sharp mean reversion the following year.
- Overlooking Manager Tenure Transitions: If a scheme displays a stellar 10-year CAGR of 18%, but the lead fund manager who generated that track record departed six months ago, attributing that performance to the incumbent manager is a critical mistake. Always align performance data with the current manager’s actual tenure.
- Comparing Against Mismatched Benchmarks: Evaluating a mid-cap fund against the Nifty 50 or comparing a value fund against a growth-dominated index provides false conclusions. Ensure the fund is assessed against its official category TRI benchmark (e.g., Nifty Midcap 150 TRI or BSE 500 TRI).
- Ignoring Changes in Cash Strategy: Interpreting high cash holdings as conservative risk management during a bull run can mask a manager’s inability to identify attractive opportunities within their mandate.
Step-by-Step Fund Manager Performance Analysis Framework
Follow this sequential checklist to systematically evaluate active equity fund managers in your portfolio:
[Step 1: Verify Manager Tenure]
       │ (Ensure current manager has steered the fund for at least 3-5 years)
       ▼
[Step 2: Evaluate 3-Yr & 5-Yr Rolling Returns]
       │ (Target >75% win-rate against category TRI benchmark)
       ▼
[Step 3: Audit Risk-Adjusted Ratios]
       │ (Screen for Sortino >1.8 and Information Ratio >0.50)
       ▼
[Step 4: Check Capture Asymmetry]
       │ (Confirm Upside Capture >100% and Downside Capture <80%)
       ▼
[Step 5: Inspect AUM & Portfolio Composition]
       │ (Check for AUM bloat, stock dilution, and excessive turnover)
       ▼
[Step 6: Confirm Skin-in-the-Game & Governance]
       │ (Verify mandatory SEBI manager allocations and AMC stability)
       ▼
[Decision: Retain, Place on Watchlist, or Switch]
- Verify Tenure Continuity: Check the AMC fact sheet to confirm that the lead fund manager has managed the scheme for at least three to five years. If tenure is under two years, evaluate the manager’s prior track record at previous schemes or fund houses.
- Run Rolling Return Distributions: Assess 3-year and 5-year rolling returns across a complete market cycle. Confirm that the median rolling return beats the benchmark TRI and that minimum rolling returns do not reveal catastrophic tail risk.
- Analyze Risk-Adjusted Metrics: Check the Sortino Ratio and Information Ratio over a 36-to-60 month window. Reject schemes where outperformance is accompanied by a sub-par Sortino ratio relative to category peers.
- Review Upside/Downside Capture Ratios: Verify that the fund exhibits strong downside containment (downside capture below 80%). A manager who limits drawdowns during corrections requires far less upside thrust to generate superior long-term wealth.
- Inspect Holdings, Turnover, and AUM Scale: Audit the monthly portfolio disclosure to verify stock count (typically 35–60 for concentrated to moderate strategies), verify that PTR aligns with the stated style, and ensure AUM growth in mid/small-caps has not degraded trading flexibility.
- Check Skin-in-the-Game Disclosures: Review the annual AMC disclosures to confirm the manager maintains substantial personal capital locked into the fund.
FAQ
What is the most reliable metric in fund manager performance analysis?
Rolling returns across 3-year and 5-year windows, paired with the Sortino Ratio, provide the most reliable quantitative foundation. Rolling returns eliminate point-to-point end-date distortions, while the Sortino ratio measures excess returns against downside risk, isolating genuine security selection from unhedged portfolio volatility.
How do you evaluate a fund manager when they take over a new fund?
When a manager assumes control of a new fund, their historical track record on that specific scheme is reset. Investors should analyze the manager’s multi-year rolling returns, capture ratios, and style consistency in their previous funds or mandates. If the manager has no prior public track record, monitor the fund on a watchlist for 12 to 18 months to evaluate style execution before committing fresh capital.
Why is downside capture ratio critical in fund manager performance analysis?
Downside capture ratio measures the percentage of market losses a fund absorbs during negative benchmark months. Because a 50% portfolio loss requires a 100% gain simply to break even, a manager who restricts downside capture to under 75% or 80% protects capital during corrections, significantly reducing the return hurdle needed to outperform over a full market cycle.
How does AUM growth impact fund manager performance in Indian mutual funds?
Rapid AUM growth can create capacity and liquidity constraints, particularly in small-cap and mid-cap categories. When a fund’s asset base grows too large, the manager faces high market impact costs when buying or selling illiquid stocks, often forcing them to diversify into 70+ companies or allocate capital to large-caps, which can dilute active alpha generation.
What is SEBI’s skin-in-the-game rule for mutual fund managers?
Under SEBI regulations, asset management companies must mandate that designated key employees, including fund managers, invest at least 20% of their net annual compensation (salary and bonuses) into the mutual fund schemes they manage or oversee. These investments are locked in for a minimum of three years or the scheme tenure, ensuring that managers have direct financial exposure to unitholder outcomes.
Conclusion
Fund manager performance analysis is not an exercise in identifying last year’s top-performing scheme. It is an ongoing due diligence discipline that separates enduring investment skill from temporary market luck. In an active investment portfolio, consistently paying management fees is only justifiable when the manager demonstrates a repeatable process, disciplined risk containment during market sell-offs, and verifiable alpha against Total Return Index benchmarks.
By combining rolling return distributions, downside risk-adjusted metrics like the Sortino and Information Ratios, and qualitative checks on AUM capacity, portfolio turnover, and SEBI skin-in-the-game alignment, Indian investors can construct an active mutual fund portfolio capable of navigating shifting market cycles and compounding wealth over the long term.
- Tags:
- Mutual Funds
- Fund Manager Performance Analysis
- Investing
- Indian Stock Market
- Personal Finance
- Portfolio Management