
Understanding Risk and Return in Mutual Funds
Master risk and return in mutual funds with practical formulas, risk ratios, SEBI riskometer insights, and portfolio balancing strategies for Indian.

- NV Trends
- 16 min read
- Updated
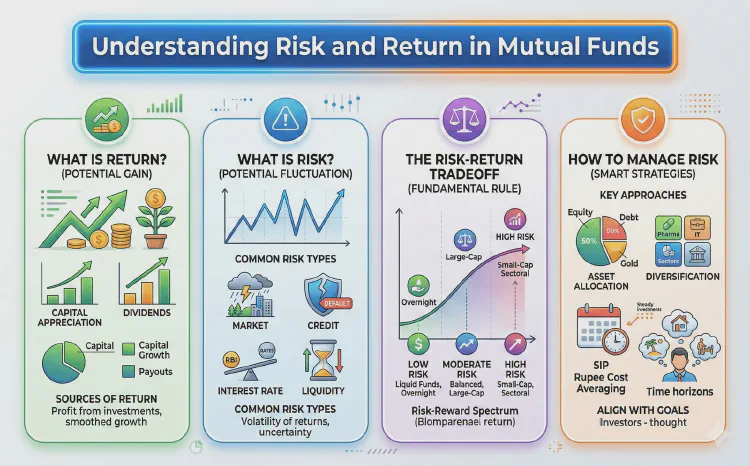
Understanding risk and return in mutual funds means evaluating how much market volatility, credit exposure, or interest rate fluctuation an investor must absorb to achieve a targeted capital gain over a defined time horizon. In the Indian financial ecosystem, prospective investors often focus entirely on the upside—asking how quickly an investment can double or outpace inflation—while glossing over the structural uncertainties that generate those returns.
Risk and return are inseparable economic companions. In market-linked instruments, higher expected returns serve as financial compensation for accepting unpredictability, cyclical drawdowns, and occasional capital depreciation. Conversely, products offering capital preservation demand an acceptance of modest gains that may barely outpace consumer inflation.
For retail investors navigating domestic markets, building wealth through mutual funds requires transitioning from chasing short-term returns to analyzing risk-adjusted performance. Recognizing how asset allocation, scheme selection, and statistical ratios interact allows you to construct a resilient portfolio tailored to your unique financial milestones.
Key takeaways
- Symmetric relationship: Return is the financial reward for bearing quantifiable risks; expecting high equity-like returns without downside volatility is mathematically impossible in regulated markets.
- Accurate measurement matters: Calculate short-term gains using absolute return, multi-year lump sums using Compounded Annual Growth Rate (CAGR), and periodic Systematic Investment Plans (SIPs) using Extended Internal Rate of Return (XIRR).
- Ratios reveal quality: Metrics such as Standard Deviation, Beta, the Sharpe Ratio, and the Sortino Ratio highlight whether a fund manager generates alpha through genuine skill or by taking excessive underlying risk.
- Regulatory transparency: The monthly six-stage Riskometer mandated by the Securities and Exchange Board of India (SEBI) provides an objective visual indicator of portfolio risk across equity, debt, and hybrid schemes.
- Horizon dictates allocation: Mitigating risk is best achieved not by market timing, but by matching your investment time frame with the appropriate fund category and rebalancing regularly.
What is Return in Mutual Funds? Calculating Gains Accurately
In mutual funds, return represents the net financial gain or loss realized on an investment over a specific duration. These returns accrue primarily through capital appreciation—an increase in the Net Asset Value (NAV) of scheme units driven by the performance of the underlying stocks, bonds, or money market instruments—and periodic payouts under the Income Distribution cum Capital Withdrawal (IDCW) option.
Evaluating fund performance requires utilizing the correct mathematical methodology based on cash flow timing and duration:
1. Absolute Return (Point-to-Point)
Absolute return measures the simple percentage increase or decrease in an investment over a given timeframe, ignoring the element of annual compounding:
$$\text{Absolute Return} = \left(\frac{\text{Current Value} - \text{Initial Value}}{\text{Initial Value}}\right) \times 100$$
For example, if you invested Rs. 1,00,000 in an arbitrage fund and the value grew to Rs. 1,07,000 after nine months, your absolute return is 7.0%. While straightforward, absolute return becomes misleading when applied to periods longer than 12 months because it does not reflect annualized performance.
2. Compounded Annual Growth Rate (CAGR)
For lump-sum investments held for more than one year, CAGR provides the standardized annual growth rate required for the initial capital to reach its terminal value, smoothing out interim volatility:
$$\text{CAGR} = \left[\left(\frac{\text{Current Value}}{\text{Initial Value}}\right)^{\frac{1}{n}} - 1\right] \times 100$$
If an investment of Rs. 2,00,000 in a large-cap equity fund grows to Rs. 3,50,000 over five years ($n = 5$), the CAGR is approximately 11.84%. While CAGR is the industry benchmark for comparing multi-year fund performance against broad indices like the Nifty 50 TRI, it assumes uniform annual growth and applies strictly to single cash inflows.
3. Extended Internal Rate of Return (XIRR)
Most retail participants invest through monthly SIPs, Systematic Transfer Plans (STPs), or intermittent lump sums. Because each installment buys units at different NAVs on different dates, CAGR cannot accurately compute the realized return.
XIRR solves this by aggregating multiple staggered cash inflows and outflows alongside their specific transaction dates to calculate a unified annualized return. When you review your SIP portfolio statement on an investment portal, the return percentage displayed is almost universally calculated via XIRR.
4. Rolling Returns: The Real Consistency Metric
Point-to-point trailing returns (such as 3-year or 5-year returns shown on fund factsheets) suffer from recency bias. If the end date coincides with an artificial market peak or trough, the performance appears inflated or depressed.
Rolling returns eliminate this distortion by calculating annualized returns continuously across overlapping intervals (e.g., measuring every 5-year period starting daily over the past ten years). Independent research platforms such as Value Research rely heavily on rolling returns to evaluate how consistently a fund beats its benchmark across different market cycles.
What is Risk in Mutual Funds? Deconstructing Volatility and Capital Loss
In common parlance, risk is equated with permanently losing money. While capital erosion is the worst-case scenario, in professional portfolio management, risk represents volatility and uncertainty—the probability that the actual return will deviate significantly from the expected return.
Risks in the Indian mutual fund landscape fall into two overarching domains: systematic (market-wide) and unsystematic (specific to an issuer or sector).
Systematic Risk (Market Risk)
Systematic risk stems from macroeconomic, geopolitical, or regulatory factors that impact the entire financial system. Events such as shifts in central bank interest rates, changes in crude oil prices, fluctuations in the value of the Indian Rupee against the US Dollar, or global supply chain shocks cause broad market indices to decline. Diversification across multiple equity stocks cannot eliminate systematic risk; when the Sensex drops 10% during a broad correction, even fundamentally sound large-cap equity funds typically experience mark-to-market drawdowns.
Unsystematic Risk (Specific Risk)
Unsystematic risk is tied directly to a specific company, industry, or issuer. Examples include labor strikes at an automotive manufacturer, management fraud, or sudden technological obsolescence in a sector. Because unsystematic risk is localized, fund managers can mitigate it through broad diversification across unrelated companies and industry verticals.
Specific Risk Dimensions in Debt and Equity
Depending on whether a fund invests in shares, corporate debentures, or sovereign securities, it faces distinct operational risks:
- Credit Risk (Default Risk): Prevalent in corporate debt and credit risk funds, this is the risk that a bond issuer fails to pay scheduled coupon interest or defaults on principal repayment at maturity. Credit rating downgrades also cause immediate write-downs in a debt fund’s NAV.
- Interest Rate Risk (Duration Risk): Bond prices share an inverse relationship with prevailing interest rates. When the Reserve Bank of India (RBI) hikes the repo rate, bond yields rise, causing existing bond prices to drop. Funds holding long-duration government securities (G-Secs) face higher NAV volatility during rate-hiking cycles than ultra-short-duration funds. For a comprehensive breakdown of fixed-income structures, read our guide on Understanding Debt Fund Categories in India.
- Liquidity Risk: This occurs when a fund manager cannot execute transactions at fair market value due to a lack of willing buyers or sellers. Liquidity constraints are particularly acute during market panics in lower-tier small-cap stocks or unlisted/illiquid corporate paper.
- Concentration Risk: Investing heavily in a single stock, sector, or thematic mandate exposes the portfolio to severe drawdowns if that specific theme falls out of market favor.
The Risk-Return Spectrum Across Mutual Fund Categories
Different mutual fund categories are engineered to satisfy varying risk appetites and financial horizons. To choose the right vehicle, you must understand where each category falls along the risk-return spectrum.
The following table summarizes the typical risk characteristics, return dynamics, and recommended holding periods across major mutual fund categories in India as of 2026:
| Category | Primary Asset Class | Key Risk Factors | Volatility Profile | Indicative Horizon | Primary Investor Objective |
|---|---|---|---|---|---|
| Overnight & Liquid Funds | Money market instruments, T-Bills (<91 days) | Reinvestment risk, negligible credit risk | Extremely Low | 1 day to 3 months | Capital preservation, emergency parking |
| Short Duration / Corporate Bond | Debentures, commercial paper (1–3 years) | Moderate interest rate risk, mild credit risk | Low to Moderate | 1 to 3 years | Stable accrual income beating standard savings |
| Conservative Hybrid Funds | 75–90% Debt, 10–25% Equity | Interest rate fluctuations, minor equity drawdowns | Moderate | 2 to 3 years | Regular income with modest inflation protection |
| Balanced Advantage / Dynamic Asset Allocation | Dynamically shifts between equity (30–80%) & debt | Model risk, equity market volatility | Moderate | 3 to 5 years | Automatic asset allocation with downside cushions |
| Large-Cap Equity Funds | Top 100 companies by market cap | Systematic market risk, economic cycles | Moderately High | 5+ years | Core wealth accumulation with blue-chip stability |
| Flexi-Cap / Multi-Cap Funds | Large, mid, and small-cap equities | Market swings, sector rotation, small-cap exposure | High | 5 to 7 years | Long-term capital appreciation across economic segments |
| Mid-Cap & Small-Cap Funds | Beyond the top 100 listed companies | High liquidity risk, business failure risk, sharp drawdowns | Very High | 7 to 10+ years | Aggressive wealth creation, high risk tolerance |
| Sectoral / Thematic Funds | Specific sectors (e.g., Banking, Tech, Pharma) | Severe concentration risk, cyclical downturns | Extreme | 5 to 7+ years (tactical) | High-conviction tactical bets by experienced investors |
Understanding these categories prevents unrealistic expectations. Expecting a small-cap fund to provide stability during a market crash, or expecting a liquid fund to beat real estate inflation over a decade, reflects a fundamental misalignment of risk and return.
Statistical Metrics to Evaluate Risk-Adjusted Returns
Relying solely on trailing returns is one of the most common pitfalls in retail investing. A fund generating a 20% return might seem superior to one returning 16%, but if the former took three times the risk, it may leave investors vulnerable to devastating drawdowns during a bear market.
Analysts evaluate whether fund managers deliver genuine value using quantitative, risk-adjusted metrics published in monthly fund factsheets and data aggregators like Moneycontrol.
1. Standard Deviation
Standard deviation measures the degree of dispersion of a fund’s periodic returns around its historical mean. In practical terms, it quantifies total volatility:
- A fund with an average monthly return of 1.2% and a low standard deviation delivers steady, predictable outcomes.
- A fund with the same average return but a high standard deviation experiences wide, unpredictable swings.
If two funds within the flexi-cap category deliver identical 14% CAGRs over five years, the fund with the lower standard deviation offered a smoother, less stressful journey for investors.
2. Beta
Beta measures a fund’s sensitivity to movements in its broad benchmark index (such as the Nifty 50 or BSE 500):
- Beta = 1.0: The fund moves in lockstep with the benchmark.
- Beta > 1.0: The fund is more volatile than the market. A beta of 1.25 indicates that if the benchmark rises by 10%, the fund is theoretically expected to gain 12.5%; however, if the index drops by 10%, the fund may fall by 12.5%.
- Beta < 1.0: The fund exhibits lower volatility than the benchmark. A beta of 0.85 means the fund captures less downside during corrections, making it suitable for conservative investors.
3. Sharpe Ratio
Developed by Nobel laureate William Sharpe, this ratio calculates the excess return generated by an investment over the risk-free rate per unit of total risk (standard deviation):
$$\text{Sharpe Ratio} = \frac{R_p - R_f}{\sigma_p}$$
Where:
- $R_p$ = Return of the portfolio
- $R_f$ = Risk-free rate (in India, typically based on the 91-day Treasury Bill yield or the RBI repo rate)
- $\sigma_p$ = Standard deviation of the portfolio’s excess return
A higher Sharpe ratio indicates superior risk-adjusted performance. A fund manager with a high Sharpe ratio generates returns efficiently rather than by taking reckless risks.
4. Sortino Ratio
While the Sharpe ratio penalizes both upward and downward volatility equally, investors rarely complain when an asset surges upward unexpectedly. The Sortino ratio refines this by measuring excess return relative only to downside deviation:
$$\text{Sortino Ratio} = \frac{R_p - R_f}{\sigma_d}$$
Where $\sigma_d$ is the standard deviation of negative asset returns. For equity investors who fear sharp losses rather than overall fluctuation, the Sortino ratio is often the more relevant metric when choosing between high-growth funds.
5. Alpha
Alpha represents the value added by an active fund manager above the return predicted by the fund’s beta and benchmark performance. A positive alpha (e.g., +2.5) indicates that the manager outperformed the benchmark after accounting for the risk assumed. A negative alpha means the fund underperformed its risk-adjusted benchmark, suggesting that a low-cost passive index fund might have served the investor better. To understand how fees impact net alpha, review our detailed guide on Understanding Expense Ratios in Mutual Funds.
The SEBI Riskometer: Standardized Risk Profiling
To protect retail investors from misleading marketing, SEBI mandates that all mutual fund schemes display a graphical “Riskometer” on their marketing materials, factsheets, and application portals.
The framework, refined in consultation with the Association of Mutual Funds in India (AMFI), classifies schemes into six distinct tiers:
- Low Risk: Highly secure short-term instruments (e.g., overnight funds).
- Low to Moderate Risk: Short-maturity debt funds holding high-grade paper.
- Moderate Risk: Short to medium-term debt schemes, arbitrage funds.
- Moderately High Risk: Conservative hybrid funds, high-quality corporate bond funds with moderate duration.
- High Risk: Pure large-cap equity funds, aggressive hybrid funds.
- Very High Risk: Mid-cap, small-cap, sectoral, thematic, and international equity funds.
Fund houses must evaluate their portfolios monthly based on strict underlying parameters:
- For Debt Securities: The risk score incorporates credit risk (ratings from AAA down to below investment grade), interest rate risk (Macaulay duration), and liquidity risk.
- For Equity Securities: The score reflects market capitalization (large, mid, or small cap), portfolio volatility, and liquidity (impact cost of trading the underlying shares).
Because the Riskometer is recalculated monthly, any change in a fund’s risk profile must be formally communicated to existing unitholders, providing a transparent early warning if a fund manager takes on excessive risk to boost returns.
How to Balance Risk and Return in Your Mutual Fund Portfolio
Managing investment risk does not mean avoiding volatile asset classes entirely; it means assembling a balanced portfolio that achieves your long-term goals without exceeding your risk tolerance.
       [ Long-Term Financial Goals ]
                     |
       +-------------+-------------+
       |                           |
[ Growth Assets ]           [ Stability Assets ]
  - Large/Flexi Cap           - Liquid / Short Duration
  - Mid/Small Cap             - Arbitrage / Corporate Bond
  - Gold Mutual Funds         - Fixed Income Accrual
       |                           |
       +-------------+-------------+
                     |
         [ Systematic Rebalancing ]
   (Annual / Threshold-Based Risk Management)
1. Implement Strategic Asset Allocation
Asset allocation—the distribution of capital across equity, debt, and gold—is the single largest determinant of portfolio returns and volatility over time. When equity markets experience severe downturns, debt allocations provide liquidity and capital preservation, while gold often acts as a hedge against currency depreciation and geopolitical turmoil. For practical frameworks on structuring these buckets, see our guide on How to Build a Diversified Investment Portfolio.
2. Match Fund Categories with Time Horizons
Risk diminishes as the investment horizon lengthens. Historical data from the Indian equity markets shows that while 1-year equity returns fluctuate wildly between steep negative drawdowns and massive surges, the probability of negative returns drops significantly over 7-to-10-year rolling periods.
- Goals within 1 to 3 years (e.g., emergency fund, down payment): Allocate 100% to low-risk debt or liquid funds. Avoid equity entirely.
- Goals within 3 to 5 years (e.g., car purchase, higher education buffer): Use balanced advantage or conservative hybrid funds to achieve controlled growth with a built-in cushion against downside shocks.
- Goals 7+ years away (e.g., retirement, child’s long-term education): Allocate primarily to diversified equity funds (large, flexi, and mid caps) to capture long-term compounding.
3. Harness Rupee Cost Averaging via SIPs
Attempting to time the market to buy at absolute bottoms and sell at peaks is nearly impossible for individual investors. Investing through monthly SIPs turns market volatility into an advantage.
When market corrections occur, your fixed monthly allocation automatically purchases more fund units at lower NAVs; when markets rally, fewer units are bought at higher valuations. Over multi-year cycles, this rupee cost averaging lowers your average acquisition cost and reduces the emotional stress of managing portfolio risk.
4. Rebalance Annually
Market movements naturally distort your target asset allocation over time. In a multi-year bull market, an initial target of 60% equity and 40% debt can easily shift to 75% equity and 25% debt, unintentionally exposing you to elevated risk right before a market peak.
Rebalancing involves periodically trimming profits from the outperforming asset class and reallocating capital to the lagging asset class to restore your target weights. This disciplined process forces you to sell high and buy low without letting emotion dictate decisions.
Common Mistakes Indian Investors Make With Risk and Return
Even seasoned investors fall prey to cognitive biases and structural mistakes when assessing mutual funds:
- Recency Bias and Chasing Past Performance: Selecting last year’s top-performing fund is a common trap. Top-performing schemes in any single calendar year are often concentrated in aggressive small-cap or cyclical thematic sectors (like infrastructure, energy, or technology). When the economic cycle turns, these top performers frequently plummet to the bottom of performance tables.
- Treating Debt Funds as Bank Fixed Deposits: Many investors assume that because debt funds invest in bonds, their capital is guaranteed. In reality, debt funds are market-linked instruments subject to interest rate cycles and credit downgrades.
- Over-Diversification Across Too Many Funds: Holding 20 to 30 mutual funds does not provide superior risk management. Instead, it leads to portfolio clutter and “index hugging”—where your aggregate portfolio mimics the broader market index, but charges higher active management expense ratios. A well-constructed portfolio rarely requires more than four to six complementary funds.
- Confusing Temporary Volatility with Permanent Capital Loss: Volatility is simply the fluctuating price of admission for long-term equity returns. Panicking during a market correction and stopping ongoing SIPs or redeeming units locks in temporary paper losses, converting normal volatility into permanent capital destruction.
FAQ
What is the ideal risk-return balance for a beginner in mutual funds?
For a beginner, the ideal balance typically starts with a balanced advantage fund or a broad-market index fund (such as a Nifty 50 index scheme) paired with a short-duration debt fund. This combination provides exposure to India’s economic growth while keeping downside volatility manageable, helping new investors stay disciplined without panicking during market corrections.
How does the Sharpe ratio help determine if a high-return mutual fund is worth the risk?
The Sharpe ratio reveals whether a fund’s high returns stem from superior stock selection or excessive risk-taking by measuring excess returns over the risk-free rate per unit of volatility. A fund generating a 15% return with a high Sharpe ratio is generally a better investment than a fund generating 18% return with a very low Sharpe ratio, as the latter leaves you vulnerable to severe drawdowns during downturns.
Can an investor lose their entire principal in an Indian mutual fund?
In a diversified equity or high-grade debt mutual fund, losing your entire principal is practically impossible because the capital is spread across dozens of companies, sectors, or sovereign bonds. However, sharp paper drawdowns of 20% to 50% can occur in aggressive equity funds during severe bear markets, and credit-risk debt funds can suffer significant permanent losses if major bond issuers default.
Why do debt funds carry risk if they do not invest in equities?
Debt mutual funds carry two main risks: interest rate risk and credit risk. When the RBI raises interest rates, the market prices of existing bonds fall, reducing the fund’s NAV. Additionally, if an issuer of a corporate debenture held in the portfolio defaults on interest or principal repayments, the fund must write down the value of that holding, causing an immediate drop in investor capital.
What is the difference between CAGR and XIRR in mutual fund returns?
CAGR measures the smoothed annual growth rate of a single lump-sum investment over a period greater than one year. In contrast, XIRR is designed for multiple, irregular cash flows occurring at different dates, making it the appropriate metric for calculating returns on monthly SIPs, periodic top-ups, and systematic withdrawals.
Conclusion
Investing in mutual funds without understanding the relationship between risk and return is like driving a high-speed vehicle without knowing how to operate the brakes. While high trailing returns are appealing, building enduring wealth depends on surviving market downturns with your financial goals intact.
True investing success does not come from searching for an elusive zero-risk, high-return scheme. Instead, it comes from selecting funds whose risk-adjusted metrics, category mandates, and volatility profiles match your personal time horizon and temperament. By anchoring your portfolio in strategic asset allocation, using SIPs to average costs, and monitoring risk-adjusted ratios rather than raw returns, you can navigate the Indian capital markets with clarity and confidence.
- Tags:
- Mutual Funds
- Risk and Return
- Investing in India
- Sip
- Portfolio Management
- Personal Finance