
Understanding Expense Ratios in Mutual Funds
Learn how mutual fund expense ratios impact net returns in India, compare Direct vs. Regular plans, check SEBI caps, and protect long-term SIP wealth.

- NV Trends
- 15 min read
- Updated
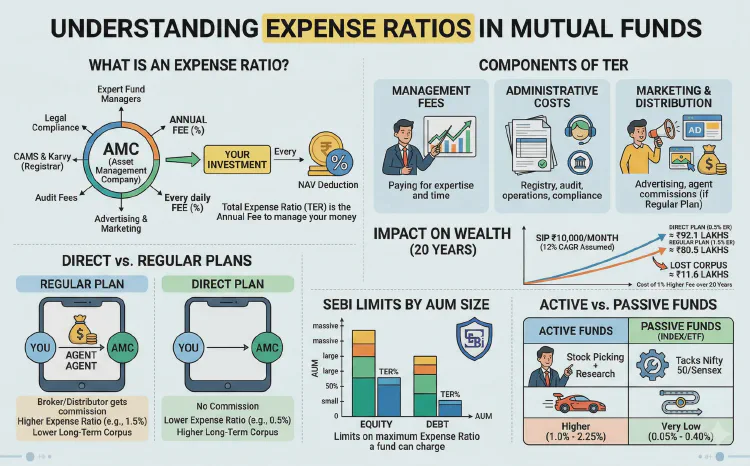
An expense ratio—technically designated as the Total Expense Ratio (TER)—is the annual percentage fee that an Asset Management Company (AMC) deducts daily from a mutual fund’s assets to cover the operational, managerial, administrative, and distribution costs of running the scheme. Expressed as an annualized percentage of the fund’s daily net assets, this fee is deducted automatically before the scheme’s Net Asset Value (NAV) is published at the end of each business day.
When building an investment portfolio in India, most retail attention naturally focuses on past annualized returns, trailing three-year performance, and fund manager reputation. Yet the expense ratio operates as a permanent friction point on your portfolio compounding. Unlike taxes or exit fees, which apply only upon redemption, the expense ratio is deducted across every market cycle—regardless of whether the underlying benchmark is surging during a bull run or declining during a prolonged bear market.
Over short horizons, an expense ratio difference of 0.50% to 1.00% may seem inconsequential on a monthly mutual fund statement. However, because compounding magnifies friction just as effectively as it magnifies profits, that subtle fee variance can divert tens of lakhs of rupees from your final retirement or wealth corpus over a 15- to 25-year investment journey. Evaluating fund expenses is therefore one of the most reliable ways to maximize your net take-home returns.
Key takeaways
- The Total Expense Ratio (TER) is accounted for on a daily basis within the fund’s published Net Asset Value (NAV), meaning all stated mutual fund returns are already net of expenses.
- Direct Plans feature substantially lower expense ratios than Regular Plans by removing distributor commissions, saving investors between 0.50% and 1.25% in annual fees.
- The Securities and Exchange Board of India (SEBI) enforces tiered regulatory caps on TERs, compelling fund houses to lower percentage fees as scheme Assets Under Management (AUM) increase.
- On a monthly SIP of Rs. 10,000 compounding over 20 years, a 1% fee difference can erode more than Rs. 11 Lakhs from an investor’s accumulated corpus.
- In passively managed index funds and ETFs, tracking error and low expense ratios are the primary determinants of scheme performance.
What Is the Total Expense Ratio (TER) and How Does It Work?
In India, an Asset Management Company operates as a financial intermediary that pools capital from retail and institutional investors to allocate across equities, fixed income securities, or commodities. Managing this capital requires portfolio managers, quantitative research analysts, legal compliance frameworks, registrar operations, and customer service teams. The Total Expense Ratio represents the consolidated annual cost charged to unitholders to maintain these services.
Because the expense ratio is expressed as an annual percentage, many unitholders mistakenly believe they will receive an annual invoice or see an explicit debit transaction in their bank accounts. In reality, the fee deduction is executed behind the scenes on a daily basis.
The AMC calculates each day’s expense by dividing the annualized TER by 365 (or 366 in a leap year) and applying that fraction to the scheme’s net assets at the close of trading:
$$\text{Daily Fee Deducted} = \frac{\text{Net Assets Under Management} \times \text{TER}}{365}$$
For example, if an equity scheme manages Rs. 10,000 Crores in AUM with an annualized TER of 1.50%, the total daily fee extracted across the entire fund pool is approximately Rs. 41.09 Lakhs. For an individual holding units valued at Rs. 5,00,000 within that fund, the daily cost is roughly Rs. 20.55. Because this deduction occurs before the daily NAV is computed, the NAV reported every evening on the official portal of the Association of Mutual Funds in India (AMFI) is already net of all management and operating expenses.
What Costs Make Up the Expense Ratio?
Under SEBI guidelines, an AMC cannot bundle arbitrary charges into a mutual fund scheme. The Total Expense Ratio is comprised of distinct, strictly audited cost buckets:
1. Investment Management and Advisory Fees
This represents the primary revenue line for the AMC. It compensates the chief investment officer, fund managers, research teams, and data infrastructure required to execute the fund’s mandate. Active funds carry significantly higher management fees than passive funds due to the human research and discretionary trading involved.
2. Registrar, Transfer Agent (RTA), and Custodian Costs
Maintaining records of unitholders, handling redemptions, processing Systematic Investment Plans (SIPs), and executing corporate actions requires specialized infrastructure. AMCs pay service fees to RTAs such as CAMS and KFintech, as well as custody fees to institutional custodian banks that physically and electronically hold the underlying securities.
3. Marketing, Selling, and Distribution Expenses
Fund houses allocate capital toward marketing campaigns, investor awareness programs, and commission payments. In Regular Plans, recurring trail commissions paid to mutual fund distributors (MFDs), banks, and brokers are included directly under this component.
4. Audit, Legal, and Trustee Fees
Mutual funds in India operate under a three-tier trust structure consisting of the Sponsor, the Trustee Company, and the AMC. Fees paid to independent trustees—who ensure the AMC adheres strictly to the Scheme Information Document (SID)—alongside statutory audit and legal compliance expenses are covered by the TER.
5. Goods and Services Tax (GST)
As of 2026, the 18% GST applicable on investment management and advisory fees is absorbed inside the scheme’s overall expense structure, ensuring unitholders face no separate tax billing for AMC services.
SEBI Limits on Mutual Fund Expense Ratios
To safeguard retail investors from excessive fee structures, the capital markets regulator enforces statutory caps on mutual fund expenses under Regulation 52 of the SEBI (Mutual Funds) Regulations, 1996. The Securities and Exchange Board of India (SEBI) mandates a tiered pricing schedule: as a mutual fund scheme attracts more capital and its AUM expands, the maximum allowable TER percentage must progressively decrease.
The regulatory philosophy relies on economies of scale. Fixed administrative and managerial expenses do not increase linearly when a fund doubles in size; therefore, cost efficiencies must be passed directly back to unitholders.
The table below outlines the statutory maximum TER limits applicable to open-ended mutual fund schemes across different asset tiers in India as of 2026:
| Scheme Asset Under Management (AUM) Slab | Maximum TER for Equity-Oriented Schemes | Maximum TER for Non-Equity / Debt Schemes |
|---|---|---|
| First Rs. 500 Crores | 2.25% | 2.00% |
| Next Rs. 250 Crores | 2.00% | 1.75% |
| Next Rs. 1,250 Crores | 1.75% | 1.50% |
| Next Rs. 3,000 Crores | 1.60% | 1.35% |
| Next Rs. 5,000 Crores | 1.50% | 1.25% |
| Next Rs. 40,000 Crores | Reduction of 0.05% for every increase of Rs. 5,000 Crores AUM | Reduction of 0.05% for every increase of Rs. 5,000 Crores AUM |
| Balance AUM (Above Rs. 50,000 Crores) | 1.05% | 0.80% |
In addition to base limits, SEBI permits specific adjustments, including additional basis points for inflows from Beyond-Top-30 (B-30) cities when permitted by prevailing circulars, as well as allowances linked to exit load structures. Investors seeking clarity on exit charges can review our comprehensive guide to Understanding Fund Exit Loads and Charges.
For index funds and exchange-traded funds (ETFs) that passively replicate a benchmark, SEBI caps the total expense ratio at 1.00%, though competitive market dynamics typically push actual TERs on large-cap index funds well below 0.30%. For fund of funds (FoFs) investing in domestic schemes, the total expense—including the underlying fund’s cost—is capped at twice the underlying scheme’s regulatory limit.
Direct Plans vs. Regular Plans: Why the Difference Matters
Since January 2013, SEBI has required every mutual fund scheme in India to offer two distinct investment routes: a Direct Plan and a Regular Plan. Both variants invest in the exact same underlying portfolio of stocks or bonds, hold identical proportions of assets, and are steered by the same fund manager. The singular operational distinction is the expense ratio.
- Regular Plans: These are purchased through intermediaries, such as independent financial advisors, mutual fund distributors, or commercial banks. The AMC pays an ongoing trail commission to the intermediary for the entire duration you remain invested. This commission is built directly into the fund’s TER, raising annual costs.
- Direct Plans: These are purchased directly from the AMC’s portal, registrar portals (CAMS/KFintech), or execution-only platforms (EOPs). Because there is no intermediary collecting a commission, the distributor charge is stripped away, resulting in a substantially lower TER.
The table below contrasts typical TER ranges across major fund categories in India as of 2026:
| Fund Category | Average Direct Plan TER | Average Regular Plan TER | Typical Annual Cost Spread |
|---|---|---|---|
| Active Large Cap Equity | 0.80% – 1.15% | 1.70% – 2.15% | 0.90% – 1.00% |
| Flexi Cap / Multi Cap Equity | 0.65% – 0.95% | 1.60% – 1.95% | 0.95% – 1.00% |
| Mid Cap & Small Cap Equity | 0.60% – 0.85% | 1.55% – 1.85% | 0.95% – 1.00% |
| Nifty 50 / Sensex Index Funds | 0.05% – 0.25% | 0.30% – 0.60% | 0.25% – 0.35% |
| Corporate Bond / Banking & PSU Debt | 0.25% – 0.40% | 0.65% – 0.90% | 0.40% – 0.50% |
| Liquid & Overnight Funds | 0.10% – 0.20% | 0.18% – 0.30% | 0.08% – 0.10% |
In active equity categories, the gap between Direct and Regular expense ratios regularly sits near 1.00% annually. To understand how expense dynamics interact with specific fixed-income instruments, consult our detailed breakdown on Understanding Debt Fund Categories in India.
The Compounding Impact of Expense Ratios on Wealth
To grasp why a 1% difference in fees matters, you must understand reverse compounding. When 1% of your portfolio is deducted each year, you lose both the cash itself and every future rupee of return that money would have generated over the remainder of your investment horizon.
Consider a disciplined investor initiating a monthly SIP of Rs. 10,000 with an assumed gross portfolio market return of 12.0% per annum before expenses:
- Direct Plan Scenario: The scheme has a TER of 0.50%, leaving a net annualized return of 11.50%.
- Regular Plan Scenario: The scheme has a TER of 1.50%, leaving a net annualized return of 10.50%.
The table below illustrates the accumulated capital across multiple timeframes based on standard compound interest formulas:
| Time Horizon | Total Invested Amount | Corpus at 11.5% Net (Direct Plan) | Corpus at 10.5% Net (Regular Plan) | Wealth Lost to Higher TER |
|---|---|---|---|---|
| 10 Years | Rs. 12,00,000 | Rs. 22,81,000 | Rs. 21,50,000 | Rs. 1,31,000 |
| 15 Years | Rs. 18,00,000 | Rs. 48,73,000 | Rs. 44,14,000 | Rs. 4,59,000 |
| 20 Years | Rs. 24,00,000 | Rs. 92,16,000 | Rs. 80,89,000 | Rs. 11,27,000 |
| 25 Years | Rs. 30,00,000 | Rs. 1,68,20,000 | Rs. 1,39,10,000 | Rs. 29,10,000 |
At the 10-year mark, the difference of Rs. 1.31 Lakhs might seem manageable. However, by year 20, the drag compounds into an absolute wealth reduction of more than Rs. 11.27 Lakhs. Over a 25-year career span, selecting the higher-fee plan diverts over Rs. 29 Lakhs—nearly the entirety of the total principal invested over that quarter-century.
Active vs. Passive Mutual Funds: The Alpha Hurdle
The divergence in mutual fund expense ratios is most pronounced when comparing active funds against passive index funds and exchange-traded funds (ETFs).
In an active equity fund, the fund manager aims to generate “alpha”—excess return above the benchmark index (such as the Nifty 50 or BSE 500)—by taking active stock bets, managing cash levels, or rotating sectors. In exchange for this effort, active funds charge a higher TER (typically 0.60% to 1.15% in Direct plans).
In contrast, a passive index fund replicates the target benchmark mechanically. Because the fund house does not employ large analytical teams or engage in frequent trading, expense ratios are minimal, often ranging from 0.05% to 0.25%.
The mathematical challenge for active fund managers is that alpha must be generated after accounting for the expense ratio. If an active large-cap fund carries a TER of 1.00% while its benchmark index fund charges 0.10%, the active manager starts every single year at an immediate 0.90% disadvantage. The active portfolio must outperform the underlying market by at least 0.91% simply to deliver the exact same net return as the passive alternative.
Published industry scorecards, including regular SPIVA (S&P Indices Versus Active) India reports and independent research from Value Research, show that in the large-cap category, the majority of active funds fail to beat their benchmark indices over 5- and 10-year investment periods after fees are factored in. This structural reality has led many investors to shift their core large-cap exposure toward ultra-low-cost index funds, reserving active management allocations for mid-cap or small-cap spaces where market inefficiencies offer broader scope for outperformance. To explore how to evaluate manager performance alongside market volatility, see our guide to Understanding Risk and Return in Mutual Funds.
How to Find and Track the Expense Ratio of Any Fund
Expense ratios are not fixed in perpetuity; AMCs frequently adjust them in response to changes in AUM, distribution renegotiations, or competitive pressures. Indian investors can verify and monitor current TERs through several transparent channels:
- AMFI Daily/Monthly TER Disclosures: Under SEBI directives, all mutual fund houses must upload their scheme-wise TERs to the AMFI portal. AMFI provides downloadable sheets highlighting any daily upward or downward revisions.
- Monthly Scheme Factsheets: At the end of every calendar month, AMCs publish detailed factsheets on their official websites. The factsheet contains a dedicated “Scheme Details” section listing the Direct and Regular TERs alongside portfolio turnover and AUM.
- Scheme Information Documents (SID) and Key Information Memorandums (KIM): These statutory legal documents provide the regulatory fee ceiling, historical expense structures, and permissible expense breakdowns for the scheme.
- Third-Party Research Portals: Platforms such as Value Research, Morningstar India, and financial aggregators display updated TER metrics along with category average benchmarks.
Watch Out for “Promotional” Expense Ratios
A common industry practice is launching a new fund—particularly an index fund, ETF, or thematic scheme—with an ultra-low introductory TER (e.g., 0.05% or 0.10%) to attract assets. Once the scheme accumulates significant AUM, the AMC may quietly raise the TER toward 0.30% or higher. SEBI mandates that fund houses notify unitholders via SMS or email at least two business days prior to any increase in expense ratios, giving investors time to evaluate whether the revised fee remains justified.
Common Mistakes Investors Make with Expense Ratios
While monitoring investment costs is vital, zeroing in on fees without broader context can lead to sub-optimal portfolio decisions. Keep the following pitfalls in mind:
- Choosing a fund solely because it has the lowest TER: A mid-cap fund charging 0.60% that consistently trails its benchmark is a worse investment than a peer charging 0.85% that consistently generates 3.00% in net excess alpha. Cost is an input; net risk-adjusted return is the outcome.
- Ignoring tracking error in passive funds: For index funds and ETFs, a microscopic expense ratio can sometimes mask high tracking error caused by poor cash management or inefficient execution. A fund with an expense ratio of 0.10% and a tracking error of 0.50% will often underperform a fund with an expense ratio of 0.20% and a tracking error of 0.05%.
- Staying in Regular plans out of inertia: Many investors who manage their portfolios independently without ongoing guidance from an advisor remain enrolled in Regular plans simply because they initiated their investments through a legacy bank distributor. Transitioning to Direct plans can immediately boost net portfolio efficiency.
- Overlooking TER impact in debt mutual funds: In equity funds, gross returns of 12% to 15% can partially absorb a 1% fee. In fixed-income funds, where gross yields may hover around 6.5% to 7.5%, a 0.75% expense ratio consumes more than 10% of your total return. Vigilance regarding fees is doubly critical in short-term and corporate bond funds.
FAQ
How is the mutual fund expense ratio deducted from my investment?
The expense ratio is not billed to you separately or debited from your linked bank account. Instead, the AMC deducts 1/365th of the annual TER from the scheme’s net asset base every day before declaring the official Net Asset Value (NAV). The NAV you see on your account statement already reflects all internal fund expenses.
Can an AMC increase the expense ratio of a mutual fund scheme?
Yes, fund houses have the discretion to adjust their scheme expense ratios up or down within the statutory caps established by SEBI. If an AMC decides to increase the base expense ratio, SEBI regulations mandate that the fund house notify existing unitholders through SMS, email, or a newspaper notice at least two business days prior to the effective date.
Is a mutual fund with a lower expense ratio always better?
Not necessarily in actively managed funds. While lower expenses provide an immediate structural advantage, fund performance ultimately hinges on investment execution, risk management, and the manager’s ability to generate alpha. In passive funds, however, a lower expense ratio paired with a low tracking error almost always yields superior tracking of the benchmark index.
Does switching from a Regular Plan to a Direct Plan trigger taxes?
Yes. Moving your holdings from a Regular Plan to a Direct Plan within the same mutual fund scheme is treated by tax authorities as a redemption followed by a fresh purchase. Consequently, the switch is subject to applicable capital gains tax rules based on your holding period, as well as any relevant exit load charges if the switch occurs within the fund’s lock-in or exit load window.
Why do debt mutual funds have lower expense ratios than equity funds?
Debt funds operate with lower expense ratios primarily because fixed-income research and bond trading generally incur fewer operational and execution overheads than active equity stock picking. Furthermore, because bond yields are lower than historical equity returns, SEBI mandates tighter regulatory expense ceilings on non-equity funds to prevent fees from consuming an excessive portion of unitholder yields.
Conclusion
The Total Expense Ratio may appear as a minor line item in a mutual fund factsheet, but it serves as one of the most reliable predictors of long-term wealth accumulation. In an era where capital markets are increasingly competitive and excess alpha is harder to generate consistently, controlling your investment costs is one of the few variables fully within your power.
Take time to audit your portfolio holdings. Compare the TER of each scheme against its respective category average and evaluate whether you are receiving commensurate advisory value for holding Regular plans. By trimming unnecessary intermediary charges, selecting cost-efficient Direct plans, and using low-cost passive index funds where active management struggles, you ensure that the power of compounding works entirely for your financial future.
- Tags:
- Mutual Funds
- Expense Ratio
- Personal Finance India
- Direct Mutual Funds
- Sebi Regulations
- Sip Investing