
Top 10 Equity Sectors to Watch in India
Explore the top 10 equity sectors to watch in India in 2026, covering structural drivers, capital expenditure trends, risks, and portfolio allocation tips.

- NV Trends
- 15 min read
- Updated
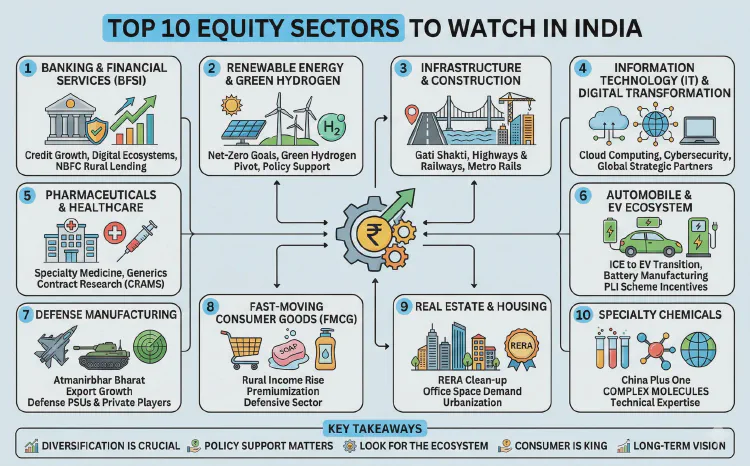
The top 10 equity sectors to watch in India are Banking and Financial Services (BFSI), Renewable Energy and Green Hydrogen, Infrastructure and Capital Goods, Information Technology (IT), Pharmaceuticals and Healthcare, Automobiles and EV Ecosystem, Defense Manufacturing, Fast-Moving Consumer Goods (FMCG), Real Estate and Housing, and Specialty Chemicals.
As India progresses along its multi-year economic expansion toward a target $5 trillion gross domestic product, the domestic equity market continues to serve as an indispensable engine of institutional and household wealth creation. For equity investors, thematic and sectoral allocations often drive portfolio dispersion more significantly than single-stock selection. Sectoral leadership in India is rarely static; it shifts along with state capital allocation, rural consumption cycles, technological shifts, and global supply chain reconfigurations.
In 2026, market performance is anchored by three primary macro forces: structural capital expenditure by public and private entities, an expanding domestic middle class driving both volume and premiumisation, and global sourcing diversification. Identifying which industries benefit directly from these structural tailwinds allows investors to position capital ahead of long-term earnings cycles rather than chasing short-term price momentum.
Key takeaways
- Capex and credit lead the cycle: Public capital expenditure and balance-sheet expansion make Infrastructure and BFSI the twin engines of domestic growth.
- Structural indigenisation creates visibility: Sectors like Defense and Renewable Energy benefit from long-term sovereign policy commitments and multi-year order books.
- Balance cyclicality with defensives: Cyclical industries (Real Estate, Capital Goods, Auto) require disciplined entry points and monitoring, balanced against steady cash-flow compounders (FMCG, Pharma).
- Supply chain realignment remains durable: The global “China Plus One” strategy continues to benefit Indian Specialty Chemicals and high-tech manufacturing.
1. Banking and Financial Services (BFSI): The Bedrock of Domestic Expansion
The Banking, Financial Services, and Insurance (BFSI) sector represents the core transmission mechanism of Indian economic expansion. As of 2026, commercial banks operate from historically resilient balance sheets following a multi-year cleanup of stressed assets, accompanied by sustained double-digit credit growth across retail, MSME, and corporate segments.
                    ┌───────────────────────────────┐
                    │  BFSI Growth Engines in 2026  │
                    └──────────────┬────────────────┘
                                   │
         ┌─────────────────────────┼─────────────────────────┐
         ▼                         ▼                         ▼
┌──────────────────┐      ┌──────────────────┐      ┌──────────────────┐
│  Asset Quality   │      │  Retail & MSME   │      │ Private Capex    │
│  Net NPAs < 1%   │      │ Credit Growth at │      │ Revival Driving  │
│  across majors   │      │ 13% - 16% CAGR   │      │ Corporate Credit │
└──────────────────┘      └──────────────────┘      └──────────────────┘
Key Drivers and Catalysts
- Credit Growth Velocity: Industry-wide loan books have expanded steadily, driven by home loans, personal consumption, vehicle financing, and working capital requirements of mid-sized enterprises.
- Healthy Asset Quality: Reports published by the Reserve Bank of India show systemic gross non-performing assets (GNPA) remaining near decade-low levels, enabling banks to maintain lower credit costs and higher return on assets (RoA).
- Fintech Integration: Traditional private and public sector lenders have integrated digital underwriting and unified payment rails, drastically lowering customer acquisition costs and expanding access into tier-2 and tier-3 geographies.
Risks to Monitor
- Net Interest Margin (NIM) Compression: As deposit rates adjust across economic cycles, cost of funds can rise faster than lending yields, squeezing spreads.
- Unsecured Credit Vigilance: Increased regulatory risk weights on unsecured retail loans necessitate careful monitoring of delinquency rates in micro-lending portfolios.
2. Renewable Energy and Green Hydrogen: Capitalising on the Clean Power Transition
India has committed to ambitious climate goals, targeting 500 GW of non-fossil energy capacity by 2030 and net-zero carbon emissions by 2070. The transition from fossil-fuel dependence to green power is backed by comprehensive fiscal frameworks, production-linked incentives, and public utility mandates.
Key Drivers and Catalysts
- The National Green Hydrogen Mission: Fiscal incentives under state programs published via the Press Information Bureau support local electrolyser manufacturing and domestic hydrogen supply chains.
- Industrial Conglomerate Capex: India’s leading private corporate groups have committed capital exceeding Rs. 5 lakh crore across solar photovoltaic (PV) cell manufacturing, wind turbine installation, and battery energy storage systems (BESS).
- Grid Infrastructure Upgrades: Clean generation requires power evacuation. Power transmission utilities and engineering firms building high-voltage direct current (HVDC) corridors enjoy long-term contract visibility.
Risks to Monitor
- Supply Chain Bottlenecks: Tariff barriers on imported components and raw material price volatility (such as polysilicon and rare earth metals) can compress project internal rates of return (IRR).
- DISCOM Financial Health: Payment delays from state power distribution companies remain an intermittent working capital risk for independent power producers (IPPs).
3. Infrastructure and Construction: The Multi-Year Capital Outlay Cycle
Infrastructure development remains the central pillar of India’s fiscal policy. The PM Gati Shakti National Master Plan has institutionalised multi-modal connectivity, transforming logistics networks across highways, railway corridors, port terminals, and urban transit networks.
       State Capex Outlays (Roads, Rail, Ports)
                        │
                        ▼
       Surging Order Books for EPC Contractors
                        │
                        ▼
   Upstream Demand: Cement, TMT Steel, Heavy Machinery
Key Drivers and Catalysts
- High Public Capex Allocation: Sustained capital budget outlays by the central and state governments directly feed the order books of engineering, procurement, and construction (EPC) companies.
- Railway and Metro Expansion: Modernisation of rolling stock, dedicated freight corridors (DFCs), and metro networks in dozens of tier-1 and tier-2 urban centers create multi-year revenue pipelines.
- Capacity Utilisation Spillovers: Rising infrastructure work drives direct volume growth for allied heavy industries, notably commercial cement producers and structural steel manufacturers.
Risks to Monitor
- Project Execution Delays: Land acquisition friction, environmental clearances, and raw material cost spikes can disrupt project execution timelines and lead to working capital strain.
- Elevated Debt Ratios: EPC firms that undertake aggressive hybrid-annuity model (HAM) or build-operate-transfer (BOT) bids risk overleveraging their balance sheets during interest rate fluctuations.
4. Information Technology (IT): Navigating the Generative AI and Cloud Shift
The Indian IT services industry remains an export powerhouse, contributing significantly to foreign exchange reserves. While discretionary tech spending in North America and Europe experiences periodic cyclical slowdowns, the long-term migration of Fortune 500 enterprises toward modern digital architecture, cloud infrastructure, and enterprise artificial intelligence provides structural stability.
Key Drivers and Catalysts
- Digital Transformation and AI Integration: Global corporations are moving past initial proof-of-concept AI trials toward enterprise-grade deployments, requiring data engineering and cybersecurity services from Indian IT vendors.
- Cost-Takeout and Vendor Consolidation: During periods of global macroeconomic tightening, multinational corporations consolidate tech vendors and offshore complex workflows to India to control operational expenditure.
- Capital Return Profiles: Tier-1 IT companies consistently generate strong free cash flow, translating into predictable dividend yields and periodic share buybacks that provide downside cushioning.
Risks to Monitor
- Global Macro Dependency: More than 70% of top-tier Indian IT revenue originates from North America and Europe; any persistent recessionary pressure directly impacts large contract signings.
- Pricing Pressure on Legacy Work: Commoditised application maintenance contracts face price deflation, necessitating rapid upskilling into higher-margin digital architecture.
5. Pharmaceuticals and Healthcare: High-Value Generics and Expanding Domestic Demand
Often termed the “Pharmacy of the World,” India’s pharmaceutical sector has evolved from low-cost generic formulation exports into complex generics, active pharmaceutical ingredients (APIs), biosimilars, and contract research and manufacturing services (CRAMS/CDMO).
┌─────────────────────────────────────────────────────────────┐
│               PHARMACEUTICAL GROWTH VECTORS                 │
├──────────────────────────────┬──────────────────────────────┤
│ Export Formulation Markets   │ Domestic Healthcare Demand   │
├──────────────────────────────┼──────────────────────────────┤
│ • Complex generics (inject-  │ • Expanding insurance cover  │
│   ables, respiratory devices)│ • Hospital bed additions     │
│ • Biosimilars patent cliff   │ • Rise in lifestyle therapy  │
│ • CRAMS / CDMO outsourcing   │ • Medical tourism inflows    │
└──────────────────────────────┴──────────────────────────────┘
Key Drivers and Catalysts
- Global CDMO Sourcing Shifts: International pharmaceutical firms are actively diversifying drug development and manufacturing partnerships away from single-nation dependencies, benefiting Indian custom synthesis providers.
- Domestic Hospital Expansion: Listed hospital networks are adding operational bed capacity in response to increased health insurance penetration and growing medical tourism inflows.
- Patent Expiries in Regulated Markets: Blockbuster biologics and specialty drugs losing patent protection create significant addressable markets for domestic formulation players.
Risks to Monitor
- Regulatory Scrutiny: Manufacturing plants undergo strict inspections by overseas health authorities (such as the US FDA); adverse inspection observations (Form 483s, warning letters) can halt production lines.
- Price Controls on Essential Medicines: Domestic drug price regulation can limit operating margins on key essential formulations.
6. Automobile and EV Ecosystem: Electrification and Premiumisation
The Indian automotive industry is experiencing a twin transformation: an accelerated shift toward electrification in specific vehicle segments and a pronounced consumer preference for premium, higher-margin personal mobility vehicles (such as compact SUVs and connected vehicles).
Key Drivers and Catalysts
- Two- and Three-Wheeler Electrification: Total cost of ownership parity and supportive state subsidies have accelerated adoption curves in light commercial vehicles and two-wheelers.
- Auto Ancillary Value Addition: Component makers are producing advanced electronics, sensors, lightweight alloys, and battery management components, significantly increasing realization per vehicle.
- Production Linked Incentives (PLI): The government’s PLI scheme for advanced automotive technology supports local value addition and export competitiveness for domestic suppliers.
Risks to Monitor
- Raw Material Volatility: Rare metal prices, steel costs, and semiconductor supply chain dislocations can squeeze manufacturing margins.
- Cyclical Financing Constraints: Rising auto loan interest rates or stricter underwriting standards can soften discretionary consumer demand in mass segments.
7. Defense Manufacturing: Indigenisation Driving Multi-Year Order Books
Historically one of the world’s largest importers of defense equipment, India has altered its strategic procurement policy through the “Atmanirbhar Bharat” defense initiative. A series of positive indigenisation lists have placed thousands of military platforms, weapons systems, and sub-assemblies on mandatory domestic procurement lists.
Key Drivers and Catalysts
- Capital Outlay Allocation: Dedicated capital acquisition budgets for domestic procurement ensure long-term revenue visibility for listed defense Public Sector Undertakings (PSUs) and private engineering groups.
- Expansion of Defense Exports: Indian manufacturers export missile systems, radar networks, armored vehicles, and precision components to friendly foreign nations, opening external revenue lines.
- Private Sector Integration: Private conglomerates and specialised precision component makers have established joint ventures with global defense manufacturers, expanding technological capabilities.
Risks to Monitor
- Working Capital and Delivery Schedules: Complex military hardware projects are susceptible to protracted testing phases, design alterations, and milestone payment delays.
- Valuation Multiples: Due to sharp market rallies, several defense counters trade at historically elevated price-to-earnings multiples that require flawless execution to sustain.
8. Fast-Moving Consumer Goods (FMCG): Defensive Cash Flows and Rural Recovery
The FMCG sector remains an indispensable defensive anchor in Indian equity portfolios. Characterised by robust brand moats, high returns on capital employed (ROCE), and consistent operating cash flows, FMCG companies cater to both everyday essentials and premium packaged alternatives.
Key Drivers and Catalysts
- Rural Demand Revival: Favourable monsoon patterns, minimum support price (MSP) increments, and direct benefit transfer programs support rural purchasing power, which accounts for roughly one-third of total FMCG revenues.
- Urban Premiumisation: Urban consumers increasingly gravitate toward packaged food, health-oriented personal care, and organic home care categories, expanding gross margins for organised players.
- Supply Chain Consolidation: Distribution efficiency via direct store delivery networks and rapid expansion across quick-commerce platforms have increased market share for organized brands.
Risks to Monitor
- Raw Material Inflation: Sharp price moves in agricultural commodities, palm oil, and packaging polymers can erode gross margins if input cost increases cannot be passed on through price hikes.
- Intense Regional Competition: Agile, local consumer brands in tier-2 and tier-3 regions compete aggressively on pricing, nibbling at market share in core commoditised categories.
9. Real Estate and Housing: Formalisation and Structural Demand
Following a decade of balance-sheet deleveraging and structural consolidation under the Real Estate (Regulation and Development) Act (RERA), the Indian property sector has entered an organised upcycle. The market has shifted decisively toward Tier-1 developers with strong execution records.
Key Drivers and Catalysts
- Inventory Consolidation: Residential inventory overhang in primary metropolitan hubs has normalized to multi-year lows, granting pricing power to established developers.
- Commercial Demand and REITs: Expanding Global Capability Centers (GCCs) and domestic corporate expansions support stable absorption of Grade-A commercial office space, providing predictable yields through Real Estate Investment Trusts.
- Consolidation of Unorganised Share: RERA compliance requirements and strict capital discipline have pushed smaller unorganised builders to enter joint development agreements (JDAs) with tier-1 listed developers.
Risks to Monitor
- Interest Rate Sensitivity: Higher home loan interest rates increase mortgage EMIs, potentially dampening housing affordability for first-time buyers in mid-income brackets.
- Regulatory and Land Acquisition Friction: Local municipal approvals, environmental permits, and title clearance complications can lead to protracted project rollout delays.
10. Specialty Chemicals: Moving Up the Global Chemical Value Chain
Indian specialty chemical manufacturers have transformed from suppliers of basic bulk chemicals into essential global suppliers of high-value active ingredients, polymer additives, specialty pigments, and agrochemical intermediates.
Key Drivers and Catalysts
- Global Supply Chain Diversification: Multinational chemical conglomerates actively pursue dual-sourcing models (“China Plus One”) to mitigate supply chain disruptions, directly directing contract volume to Indian plants.
- R&D and Complex Chemistry Mastery: Leading domestic chemical firms allocate 3% to 5% of revenues to research and process optimization, securing long-term supply arrangements with global innovators.
- Domestic Import Substitution: Increasing local consumption across electronics, pharmaceuticals, paints, and automotive manufacturing generates steady domestic demand for advanced chemical inputs.
Risks to Monitor
- Dumping and Pricing Swings: Cyclical oversupply of basic intermediates from international producers can depress realisations and compress gross margins.
- Stringent Environmental Compliance: Strict effluent treatment regulations and periodic plant safety audits require continuous capital outlays to maintain environmental compliance.
Sector Comparison: Risk, Cyclicality, and Key Metrics
To systematically evaluate the top 10 sectors, the comparison table below outlines the macroeconomic profile, primary driver, critical tracking metric, and baseline risk level for each industry as of 2026:
| Sector | Economic Classification | Primary Growth Catalyst | Critical Financial Metric to Track | Relative Risk Level |
|---|---|---|---|---|
| BFSI | Structural / Economic Proxy | Credit expansion & asset quality | Net Interest Margin (NIM) & Net NPA ratio | Moderate |
| Renewable Energy | Structural Transition | Sovereign capacity targets & capex | Capacity utilisation factor (CUF) & IRR | Moderate to High |
| Infrastructure | High Cyclical | Central & state budget capex | Order book-to-bill ratio & working capital cycle | High |
| Information Tech | Global Cyclical | Enterprise digital transformation | Constant currency revenue growth & EBIT margin | Low to Moderate |
| Pharma & Healthcare | Defensive / Structural | CRAMS, biosimilars & hospital beds | US FDA inspection status & domestic formulation RoCE | Low to Moderate |
| Auto & EV | Cyclical / Transition | Urban premiumisation & EV adoption | Volume growth (dispatches) & EBITDA per vehicle | Moderate |
| Defense | Policy-Led Structural | Mandatory domestic procurement | Multi-year order book & execution milestones | Moderate to High |
| FMCG | Defensive | Rural wage growth & premiumisation | Volume growth percentage & gross margins | Low |
| Real Estate | High Cyclical | RERA consolidation & urban demand | Quarterly pre-sales bookings & collection efficiency | High |
| Specialty Chemicals | Global Cyclical | China Plus One diversification | Asset turnover ratio & R&D spend as % of sales | Moderate to High |
How to Build a Sector-Focused Equity Portfolio
Navigating these ten sectors requires more than picking individual winning stocks; it demands disciplined portfolio construction. Because economic cycles unfold unevenly, balancing high-beta cyclical sectors with cash-generative defensive allocations helps investors capture market upsides while mitigating sharp drawdowns.
                  Illustrative Core-Satellite Framework
                 ┌──────────────────────────────────────┐
                 │       Total Equity Portfolio         │
                 └──────────────────┬───────────────────┘
                                    │
           ┌────────────────────────┴────────────────────────┐
           ▼                                                 ▼
┌──────────────────────────────┐          ┌──────────────────────────────┐
│  Core Allocation (60% - 70%) │          │ Satellite Thematic (30%-40%) │
│  • BFSI (Large Cap Banks)    │          │ • Renewable Energy & Power   │
│  • IT (Digital Transformation│          │ • Defense Manufacturing      │
│  • FMCG (Defensive Cash Flow)│          │ • Specialty Chemicals        │
│  • Pharma (Stable Formulations          │ • Infrastructure & Capital   │
└──────────────────────────────┘          └──────────────────────────────┘
When building your sectoral distribution, consider the following tactical principles:
- Adopt a Core and Satellite Structure: Allocate 60% to 70% of long-term capital into broad-market structural compounders (such as diversified financial institutions and established consumer and IT companies). Use the remaining 30% to 40% for cyclical and thematic plays (such as defense, infrastructure, and green energy) where order books provide high near-term operating leverage.
- Beware of Thematic Overconcentration: Holding excessive exposure in a single trending theme can lead to steep drawdowns when valuations run ahead of underlying earnings. Review our guide on how to avoid overexposure in equity funds to ensure your total sectoral weights align with your personal risk tolerance.
- Choose the Right Investment Vehicle: Retail investors who lack the time to analyze balance sheets, order-to-bill ratios, and quarterly earnings disclosures can participate in high-growth themes through mutual funds. You can explore our curated analysis of the top 5 sector funds to watch for active exposure, or review the broader diversified choices in the top performing equity funds FY26 to balance sector-specific risks with professional fund management.
- Monitor Valuation Divergence: When sectors trade at significant premiums to their historical averages, consider rebalancing profits into lagging sectors where valuations provide a greater margin of safety. Data published by the National Stock Exchange on sectoral P/E and P/B multiples provides a valuable baseline for relative valuation checks.
FAQ
What are the best equity sectors for long-term investing in India?
For multi-year holding horizons, sectors tied directly to structural domestic trends provide steady growth. Banking and Financial Services (BFSI), Fast-Moving Consumer Goods (FMCG), and Healthcare/Pharma offer consistent balance sheet expansion, high return on capital, and lower vulnerability to global economic contractions.
Which sectors benefit the most from Indian government capex spending?
Infrastructure, Capital Goods, Defense Manufacturing, and Renewable Energy are the direct beneficiaries of state-sponsored capital expenditure. Allocations under initiatives such as PM Gati Shakti, the National Green Hydrogen Mission, and defense positive indigenisation lists provide direct order visibility to companies in these spaces.
What is the difference between cyclical and defensive equity sectors?
Cyclical sectors (such as Infrastructure, Real Estate, and Automobiles) track broader economic expansion closely, producing strong earnings during boom cycles and contracting during downturns. Defensive sectors (such as FMCG and Pharmaceuticals) produce non-discretionary consumer goods and healthcare services, maintaining stable cash flows and operational revenues regardless of macro economic shifts.
How much portfolio exposure should be dedicated to sector-specific funds?
Financial planners generally recommend capping total thematic and sector-specific fund exposure between 10% and 20% of an overall equity portfolio. Allocating beyond this threshold increases drawdown risk if a specific industry encounters adverse regulatory headwinds or prolonged downcycles.
Conclusion
The Indian equity landscape in 2026 presents a compelling mix of domestic consumption stability and capital-intensive structural growth. While traditional compounders in Banking and FMCG continue to offer dependable balance-sheet strength, emerging themes in Renewable Energy, Defense Indigenisation, and EV component manufacturing provide dynamic high-growth opportunities.
Successful sectoral investing requires consistent tracking of underlying business metrics rather than relying solely on market sentiment. Keep a close eye on execution timelines, margin trends, regulatory pronouncements, and comparative valuation multiples. By balancing cyclical leaders with defensive anchors, investors can build an all-weather portfolio positioned to compound alongside India’s long-term economic development.
- Tags:
- Equity Sectors
- Indian Stock Market
- Sector Allocation
- Bfsi Sector
- Infrastructure Stocks
- Renewable Energy